Website traffic is the users/visitors to a website. Typically this is measured in ‘sessions’ or ‘visits’ and is a strong indicator of online presence and audience attraction.
It’s important to clarify that while web traffic certainly can be a good indicator of online performance, it only truly applies when you look at all the core data sets – such as how the users perform once they are on a page. Looking at data such as bounce rates, average time on page and conversions will identify whether the traffic you are receiving is high quality and the audience you actually want. But we’ll save that for another blog…
What does Website Traffic mean?
Your website traffic is the number of visitors to your website, which on the surface may seem like a vanity metric or may be regarded as less important, compared to your leads for example.
However, data as simple as website traffic can be a huge influence on your digital decisions. For example, if you’re tempted to try A/B (a.k.a split testing) you typically need a high traffic page to test against, or you’ll be looking at 6 months+ of data collection. Therefore, your website traffic will let you know whether you’re ready to start testing to boost conversions or whether you need to look at your traffic-driving strategies (such as SEO) first.
Furthermore, it acts as a great indicator of your SEO, PPC and Social Media performance – in terms of driving website traffic.
For example: if you have recently changed your social media strategy with the goal of increasing website traffic to your business, you can make use of Google Analytics to monitor the website traffic gained through social media.
You can pinpoint this down to the day, so if you notice a spike in your social traffic on a specific day you can correlate this back to when your social media content was posted. This will give you a clear indication of whether the strategy has increased your traffic and if any conversions have taken place from this source – which is the ultimate goal.
How do you measure it?
There are a variety of tools you can use to analyse your website data, however, the most widely used and preferred by us is Google Analytics.
There is a range of views and data sets instantly accessible with Google Analytics as soon as it is set up. On your ‘Audience’ overview you will see the core data without any filters as below

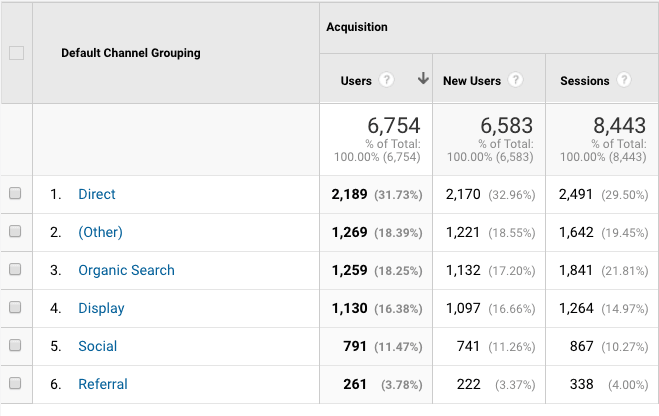
You can then use ‘Acquisition’ dropdown, click through to ‘All Traffic’ and then select ‘Channels’ which gives you a breakdown of the over-riding channels

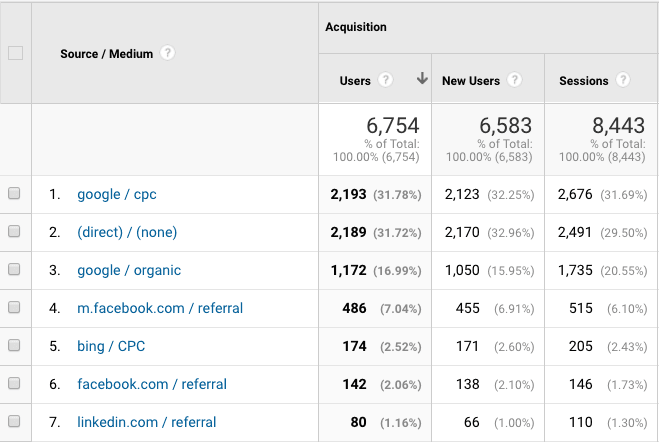
To further break this data down, you can head back to ‘All Traffic’ tab and select ‘Source/Medium’ rather than ‘Channels’. This will show you a more in-depth view of your traffic sources:

Google Analytics has the capability to perform data range comparisons, so you can look at weekly, monthly, 6 monthly, yearly (you get the point) comparison stats which is perfect for understanding the change in performance and identifying seasonal trends, which should help you prepare for changes in leads at specific times of year.
Using your traffic to increase leads:
Let’s say, at the moment you achieve 500 visitors from Organic Search per month. From those organic visitors, you achieve 20 leads (this is a 4% conversion rate), you could then create a hypothesis that if you were to achieve 1000 visitors from Organic Search per month, you could expect to achieve around 40 leads per month (still operating at 4% conversion rate).
This could be achieved by looking at the keyword which the traffic came through on and creating more content surrounding this. Or looking at a specific page or blog that performs well and creating additional content around this to attract more organic visitors.
Need a hand analysing your data and driving more traffic? Book yourself in for a 1-to-1 business growth workshop.


